Your team does not need to know security to use it: they open the console and see, in plain language, which account is compromised, what the attacker did step by step and what has already been done about it. This is the real console, during a full attack.
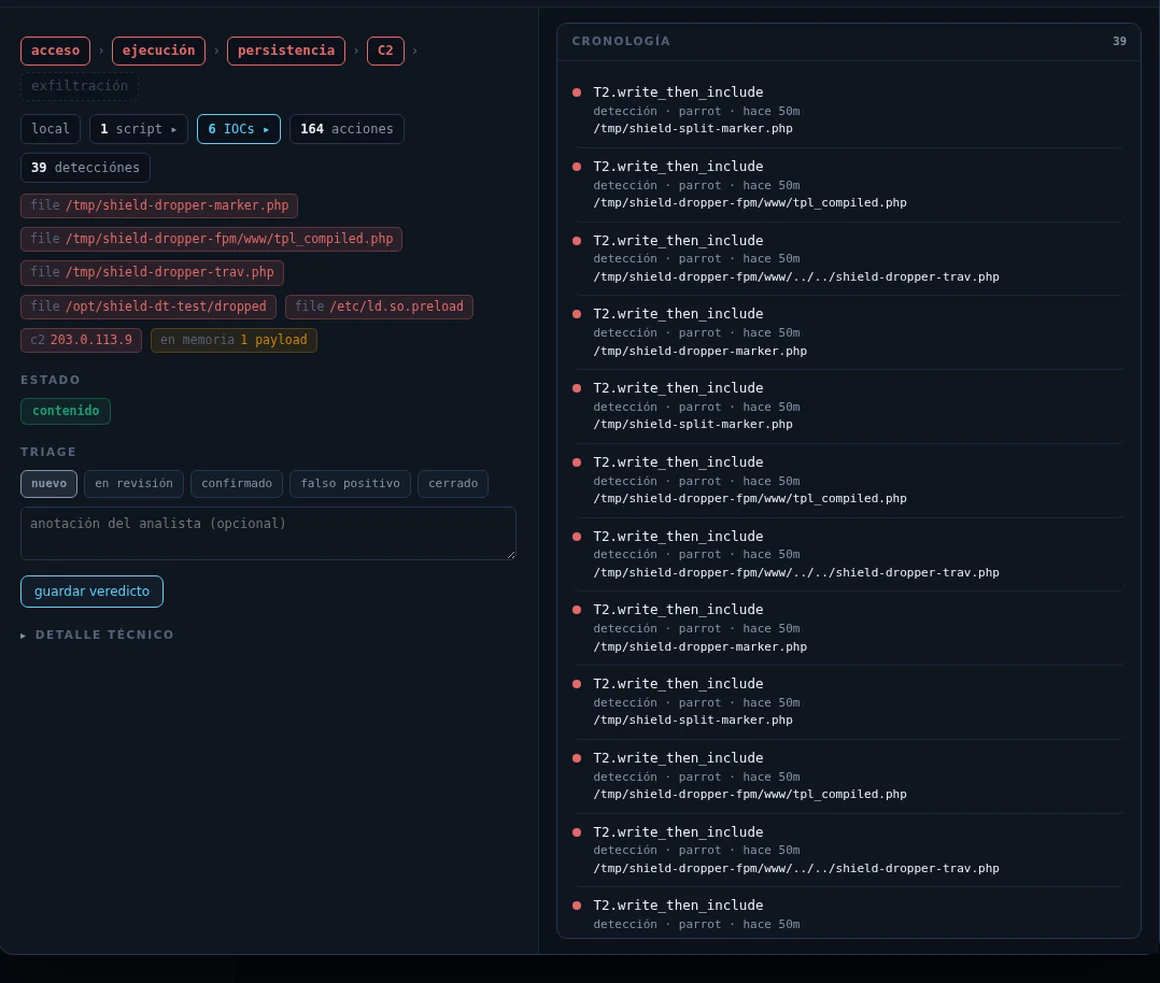
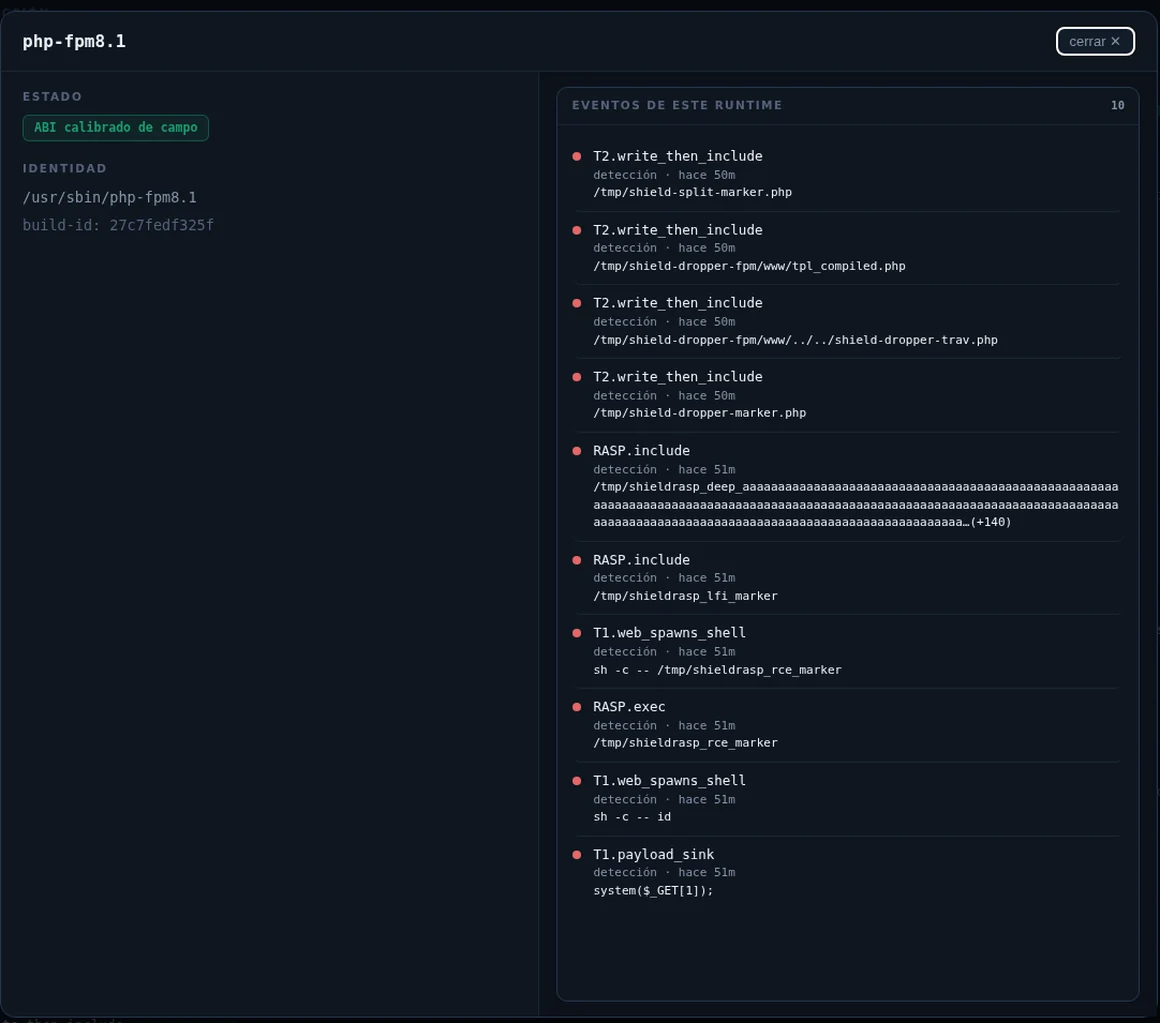
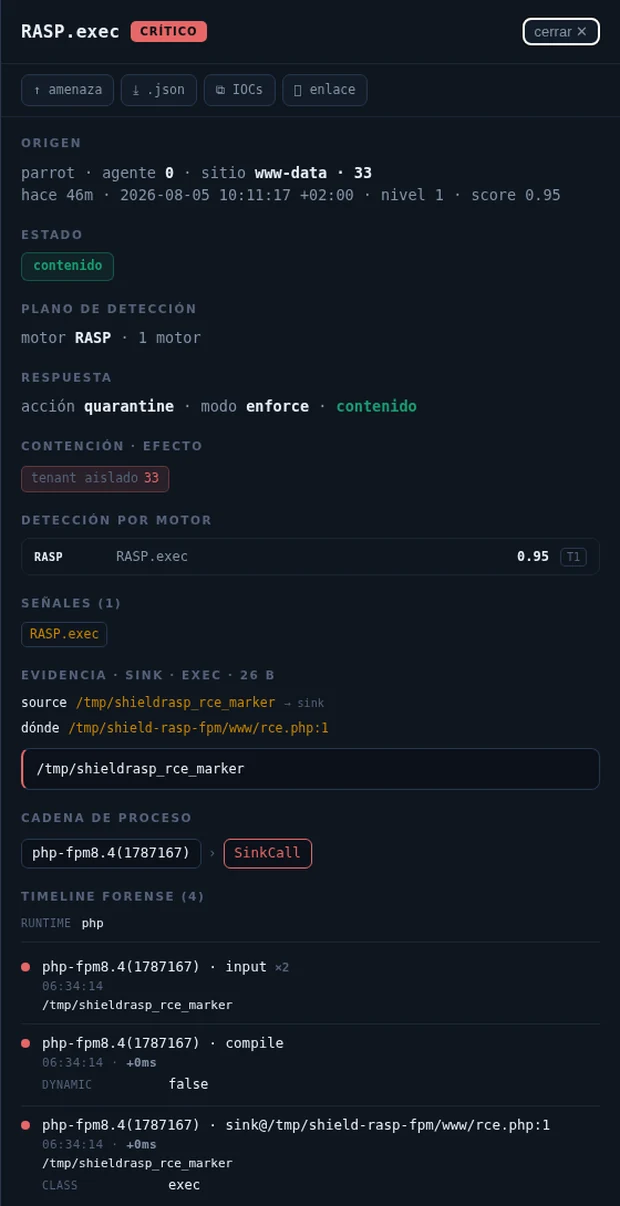
The state, at a glance. The first thing your team sees in the morning: how many incidents are still uncontained —zero, in the image— against those already neutralised on their own. Beside it, how SHIELD is working right now. If that first figure is zero, there is nothing to do today.What is protected, with nobody configuring it. Every PHP version on the server shows up on its own and is marked as calibrated. Below it, the databases and crypto libraries SHIELD is already watching. You install a new version and it enters this list without anyone touching a file.The threat, in one line. Which account, how severe, whether it is contained — and the attacker's progression: got in, executed, tried to stay and called its command-and-control. Exfiltration is greyed out because it never happened: it was cut off first.The full case file, ready to act on. On the left, the attack's indicators —the files it dropped, its command-and-control address, the code that only lived in memory— and the state: contained. Below, the analyst's work: flag, annotate and close the case, with no way to alter the evidence. On the right, the timeline of all 39 detections, one by one. And at the top, two buttons that save an afternoon: download the whole case or copy its indicators to block them across the rest of your fleet.Every piece, with its own record. You click a PHP version and see that SHIELD recognised it and adjusted to it on its own, next to everything it has seen pass through there — including the system($_GET[1]) with which the attacker tried to run commands on the server.The proof, down to the last detail. Any detection opens up and shows what an internal review would need: what the attacker sent and where it ended up —the exact value, the file and the line—; which process ran it, with its full chain; what was done in response —here, isolating the account, on the spot and without touching its neighbours—; and the timeline of that moment, millisecond by millisecond. This is what turns an alert into a closed case, and what your team attaches when the customer asks what happened.
Every screenshot is taken from the running console during a complete attack executed against a test server: access, execution, attempted persistence and a command-and-control call. The same facts you can reproduce in your own pilot.
See it on your own data
Deploy the agent on three servers and leave it in observation mode. Within days you will have the figures for your own traffic: what it would have detected, what it would have contained and with how much noise. Turning on blocking is a later configuration change, and it is your call.